.svg)
Created by: Kristinn Magnusson
In this article, you will go through everything you need to know to work with exceptions on the exMon Portal. In the exMon Portal, users get an overview of open exceptions, work with exceptions and analyze exceptions trends.
This article contains the following sections:
- Exception Overview
- Dimension Overview
- Exceptions
- Exception Actions
- Exception Detail
- Reports
- Exception Map
Getting Started
To open the portal, please navigate to the URL provided by your exMon Data Governance, and make sure to choose Exception Manager from the module selector and the correct system from the system selector, as displayed below.

Exception Overview
The main entry point into the portal is the Overview page. The overview displays information about all queries with open exceptions in the current system, categorized into folders (Data Types)
If you have "Exception Manager Admin" privileges on the selected system, then you will see all open exceptions. If you have normal privileges, then you will only see exceptions assigned to you and the groups you belong to.
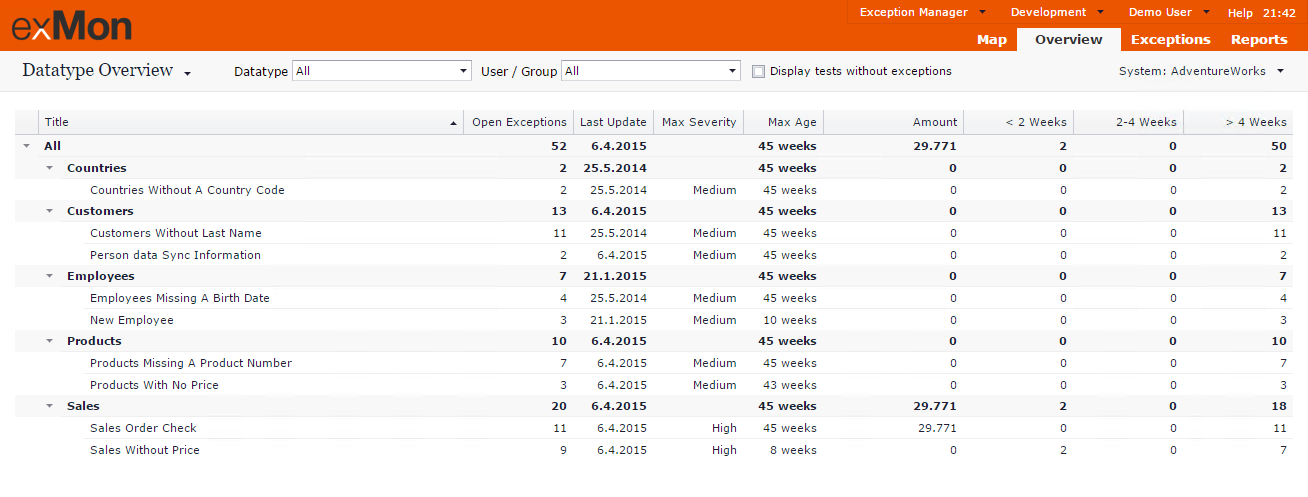
On the overview page, you get a high-level view of the status of your queries.
Columns in the overview are the following:
- Title: Names of queries (Tests) categorized into Data Types.
- Open Exceptions: Number of open exceptions, exceptions that need to be acted on.
- Last Update: Date of the latest update of the Query.
- Max Age: Age of the oldest open exception of the Query.
- Amount: Sum of the “Amount at Risk” column for all open exceptions.
- Weeks: Distribution of open exceptions by age.
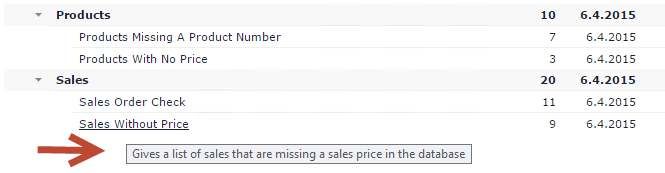
You can hover over each title to get a detailed description of each Query.
Filtering by users
All exceptions in exMon are assigned to a user or a group and on the overview page, you can filter exceptions with the "User / Group" dropdown.
Note: You need Exception Manager Admin privileges to be able to view and filter exceptions assigned to other users than yourself.
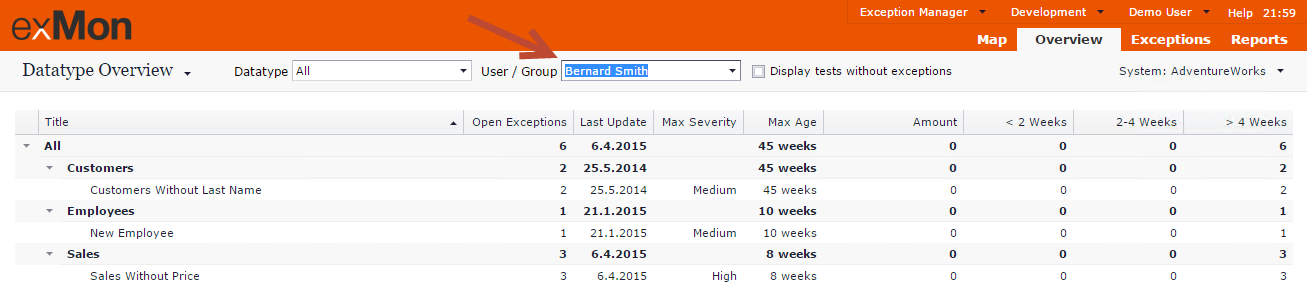
Here we can see all exceptions assigned to Bernard Smith.
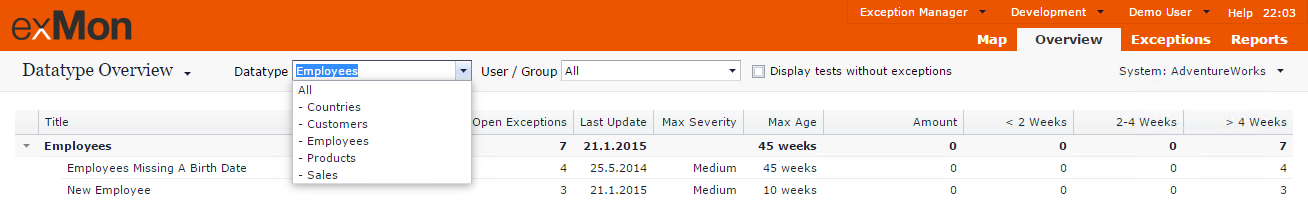
Filtering by Data Type
The overview page can also be filtered by Data Type.
Dimension Overview
By default, the Overview page is set to Data Type Overview. If you have defined Dimensions in exMon Data Governance, and have assigned Queries to Dimensions, you can also view the overview by Dimensions.
Hover over "Data Type Overview" and select the desired Dimension.
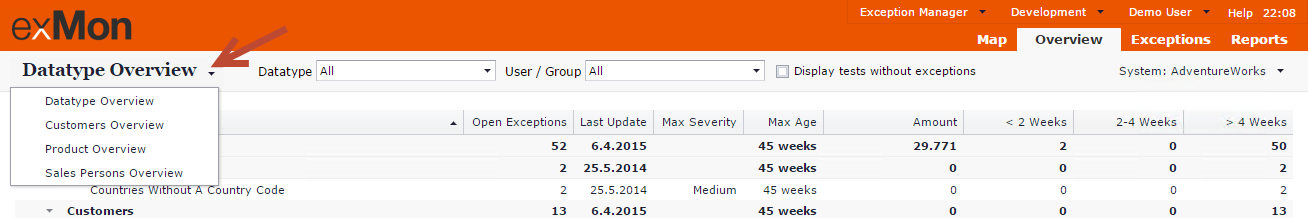
After selecting Customers Overview, the view displays the Customer Dimension as a hierarchy made up of their physical location. Each Query can have exceptions with different customers.
Notice that only 19 of the 52 open exceptions in our system are connected to the Customers Dimension.
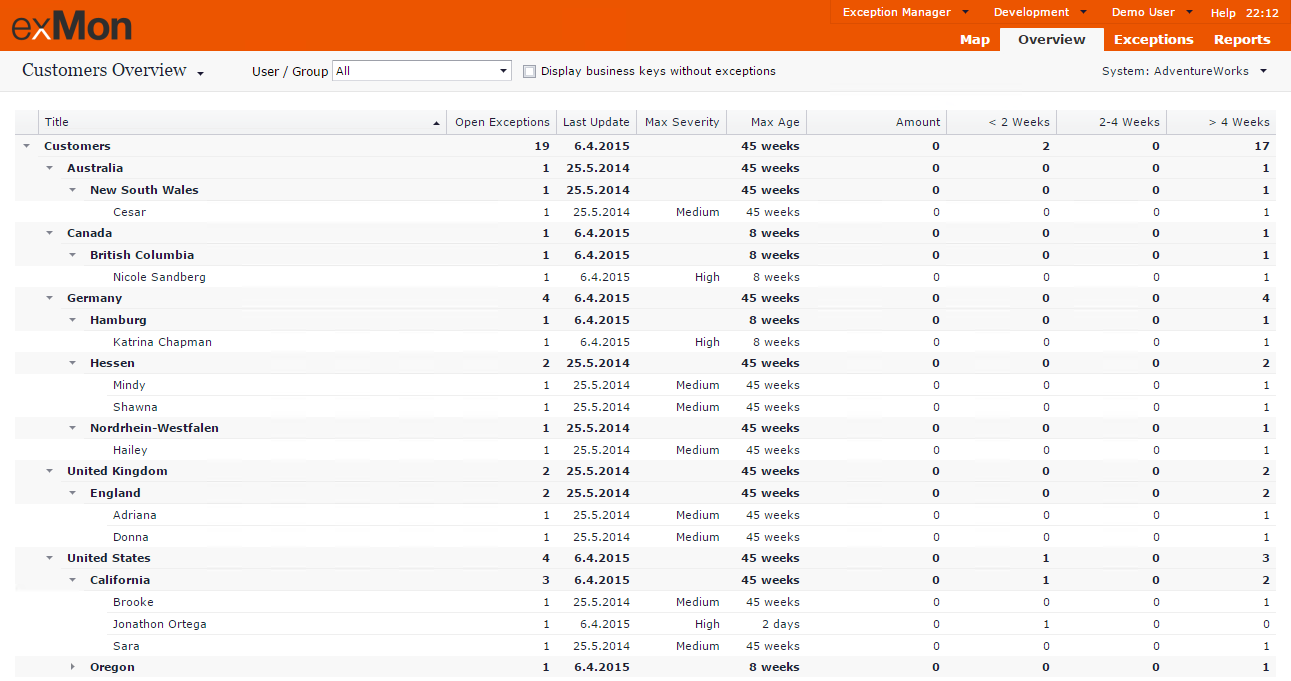
To get more information about the Query and its exceptions, we can click the title. We will then see a detailed view of each exception as explained below.
Exceptions
If you click a Query title on the Exception Overview page or select the Exceptions tab and then click a Query title, you will get a list of all open exceptions for a Query.
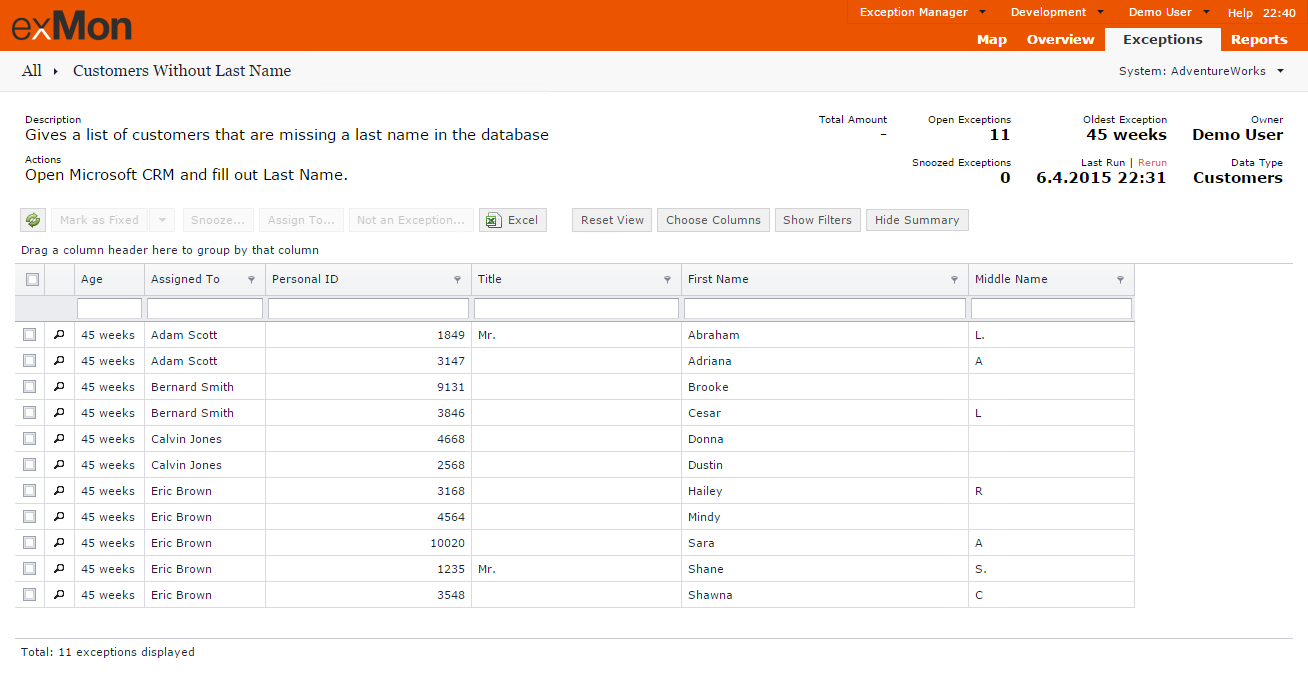
At the top, we have summary information about the selected Query and its exceptions.
- Description: Description of what the Query is monitoring.
- Action: Description of what actions should be taken to fix the data quality issue.
- Total Amount: Sum of “Amount at Risk” for open exceptions.
- Open Exceptions: Number of open exceptions.
- Snoozed Exceptions: Number of snoozed exceptions. That is exceptions that are open but temporarily hidden from the exception page. Snooze is covered later in this article.
- Oldest Exception: Age of the oldest open exception in the Query.
- Last Run | Rerun: The date when Query was last executed. If you have enough privileges, you can choose to execute the Query with the Rerun button.
- Owner: Query Owner as defined for the Query, the person who is responsible for the Query.
- Data Type: The data type the Query is in.
The summary can be hidden by clicking the Hide Summary button and exMon will remember that choice for this specific Query.
Below the summary, there is a grid with each open exception in the Query.
The columns in the grid consist of:
- Selection Checkbox: Allow you to select one or more exceptions to perform an action. Actions are explained below.
- Magnifying Glass: Allow to view each exception in more detail, including an activity history for that specific exception.
- Assigned To: All exceptions are assigned to a responsible user. This column displays which user the exception is assigned to.
Following are the columns defined in the Query, containing data from the source system.
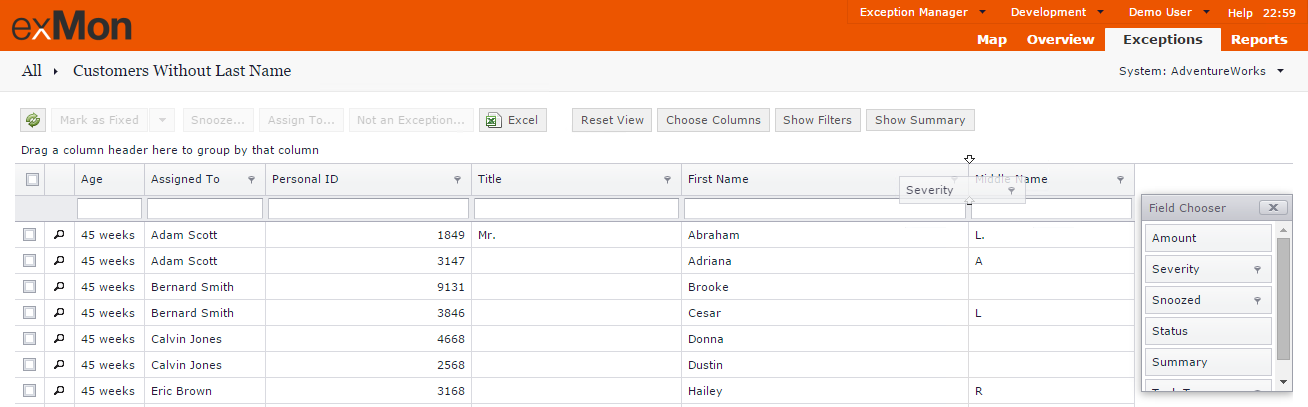
By default, the grid displays columns marked as Visible in exMon Data Governance, but the developer can also define columns that are hidden by default.
They can be useful when they only contain useful information in rare cases.
You can add hidden columns or hide visible columns, by selecting Choose Columns in the toolbar above the grid. Simply drag columns from the Field Chooser to the desired location on the grid.
You can also reorder and resize the columns by dragging the column headers.
All modifications to the grid are saved for you for that specific Query. You can reset the view to the default, by clicking Reset View.
Exceptions can be grouped by dragging the desired column to the top left corner of the grid.
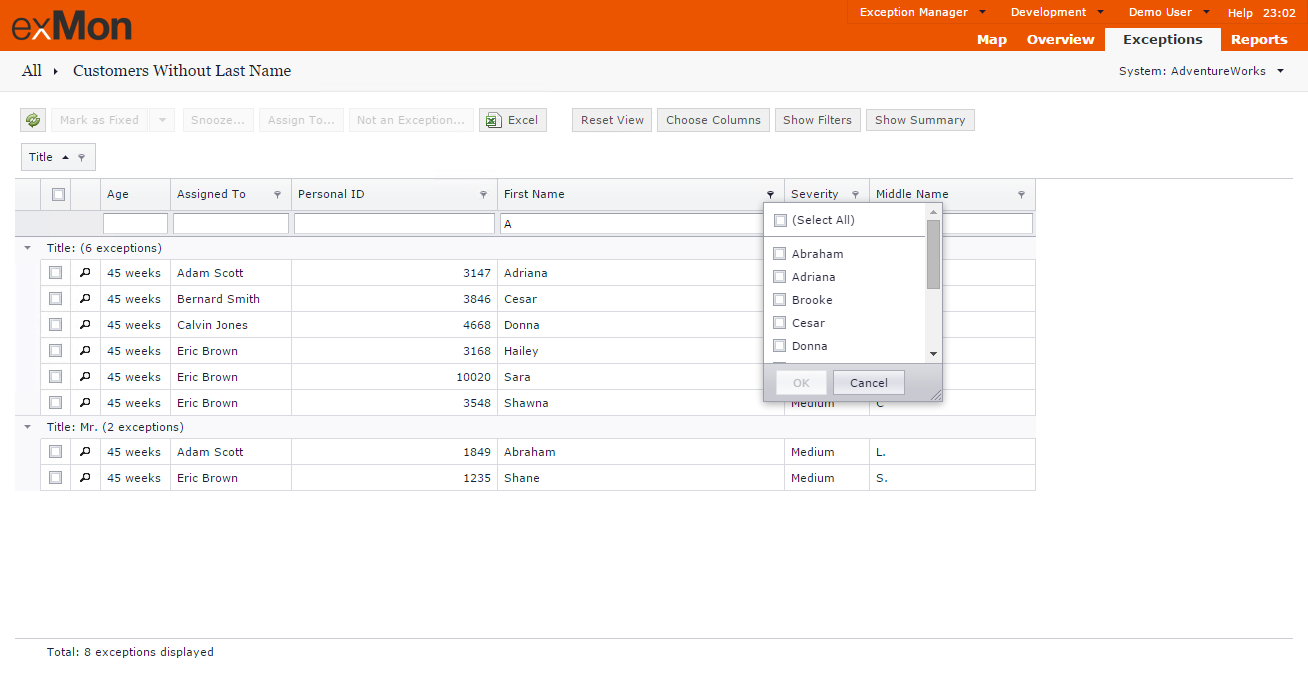
You can filter and search the data by either writing the search in the text box below the column name or by clicking the Filter button on the right-hand side of the column header.
Exception Actions
You can perform four actions on each exception:
Each action is described below.You can select one or many exceptions by checking the box in the first column.
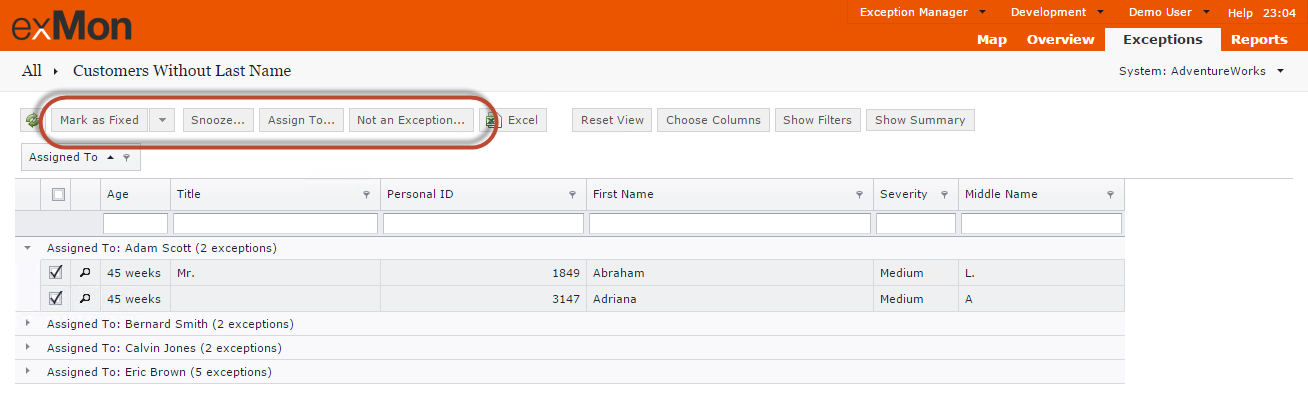
When you select an exception the action buttons are enabled.
All actions you perform and the accompanying comments are added to the activity log for each exception.
Mark as Fixed
By marking an exception as fixed, exMon treats the exception as if it has been fixed and hides it from the list of open exceptions. When the Query is executed next, the exception will stay closed if not found, or reopened if it is still found in the source system.
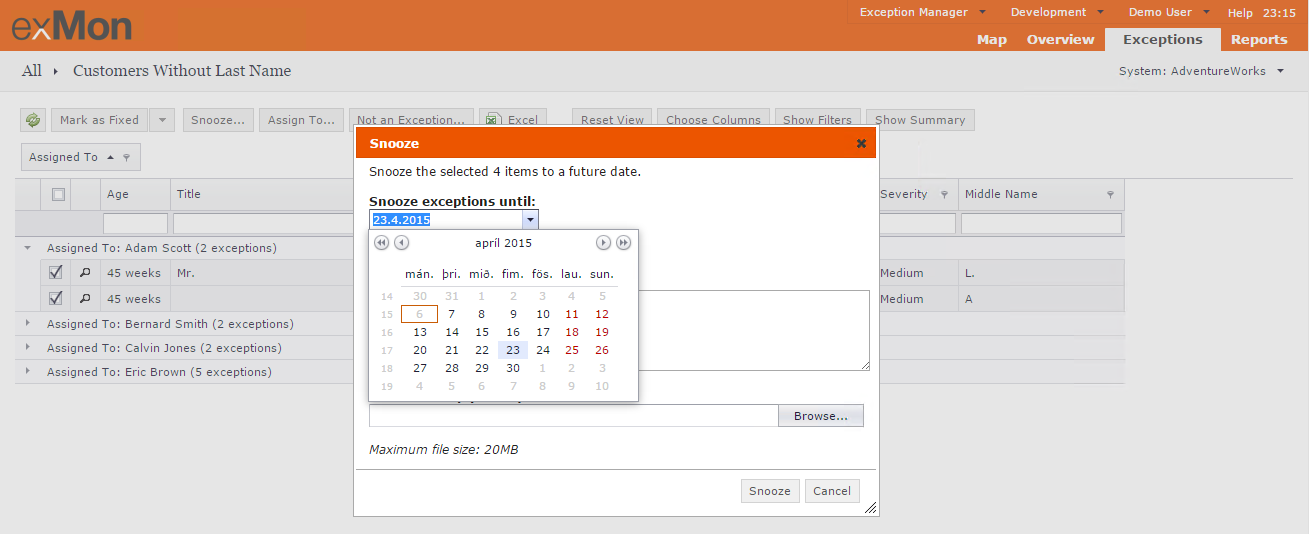
Snooze
Snoozing an exception temporarily hides the exception until a specific date. This can be useful if solving the exception depends on an external person or events.
If the Query is executed while an exception is in the snoozed state, and the exception is not found in the source system, then the exception will be closed.
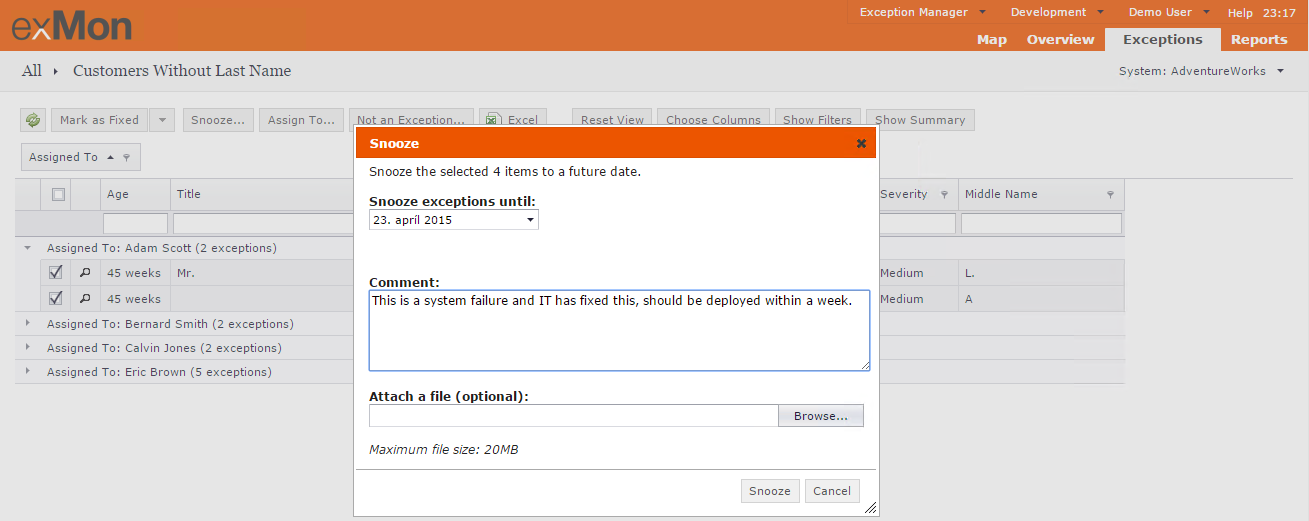
We encourage users to write comments when performing actions. The comments are attached to the exception and are great for reference when looking at similar issues in the future.
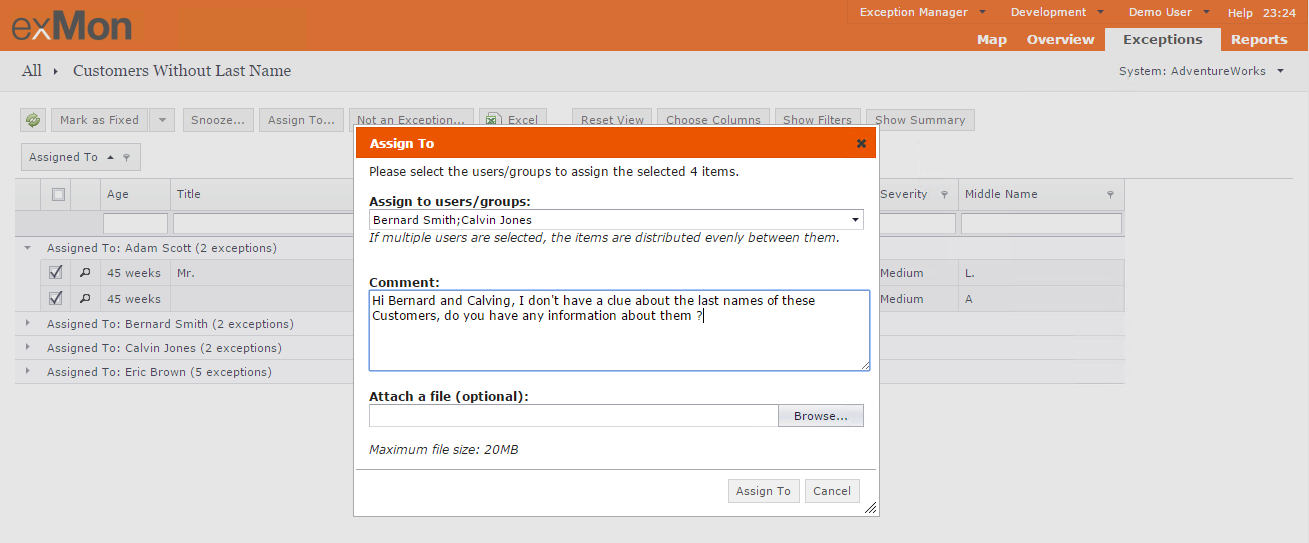
Assign To
In exMon, all exceptions are assigned to a specific user or a group, which is then responsible to work on the exception. You can assign exceptions to another user, or take ownership of an exception, with the Assign To action.
When multiple exceptions are selected, you can select multiple users and groups, and the exceptions will be divided evenly between them. All users assigned to the exception will be notified via email.
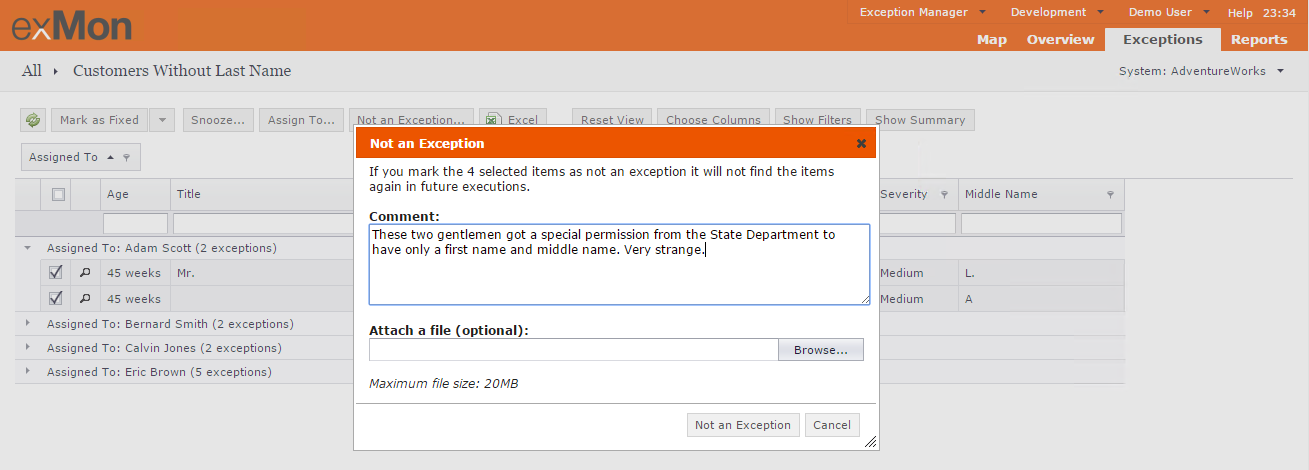
Not an Exception
When marking an exception as "Not an Exceptions", exMon will close the exception and never open it again, even if it is still present in the source system.
Be careful with this action, with great power comes great responsibility. Give a good reason for the action in the comment field to make future analysis easier.
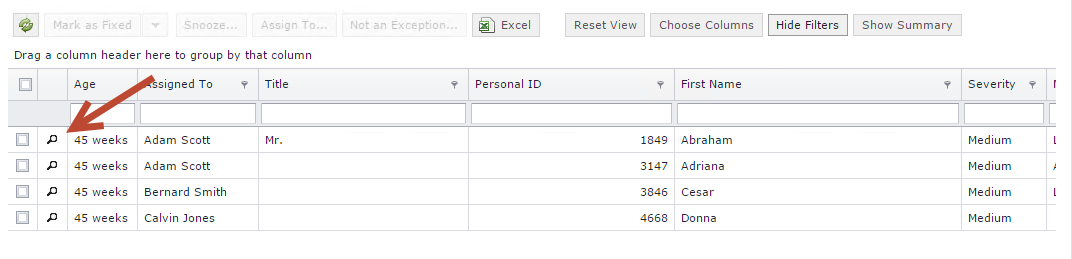
By default, the exceptions grid only displays open exceptions. You can use the Show Filters button to view exceptions in other states.
Select between Open, Closed, Snoozed and Not an Exceptions.
Exception Detail
To view an exception in more detail, click the magnifying glass in the leftmost column in the grid.
On the detail page for this specific exception, you can see summary information about the exception, detailed information about the exception and an activity log that lists all actions that have been performed on the exception.
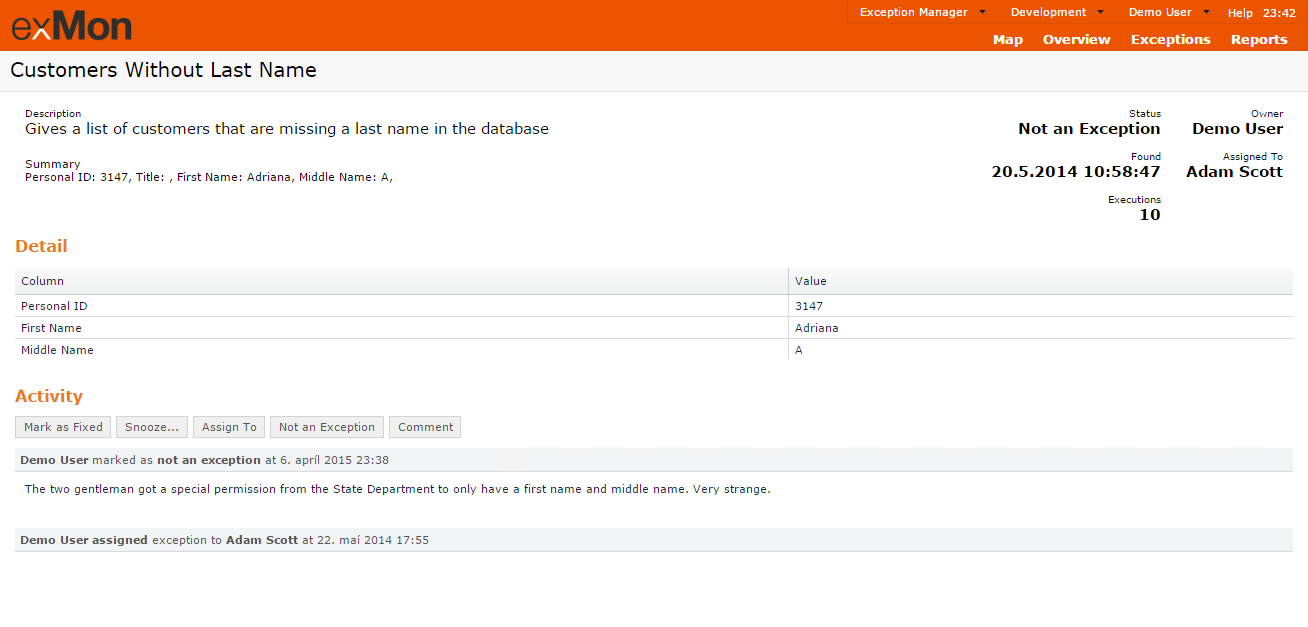
As you can see, this exception was first assigned to Adam Scott by Demo User, then later marked as Not an Exception accompanied by a comment.
Reports
The Reports section of the exMon Portal contains a list of custom-made reports, available for further analysis on exception trends or to get a better view of progress.
Clients have created reports, that for example, look at exception trends for a specific set of queries, and report on how users are progressing in solving the exceptions assigned to them.
Click a specific report to open it.
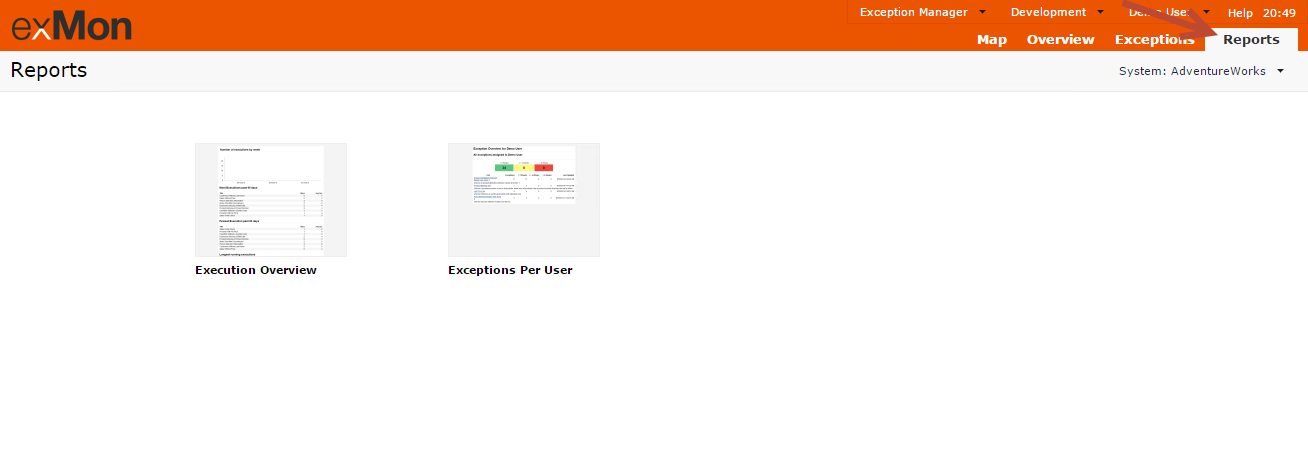
Reports can either be viewed on the portal or subscribed to, to receive a periodic email with the report.
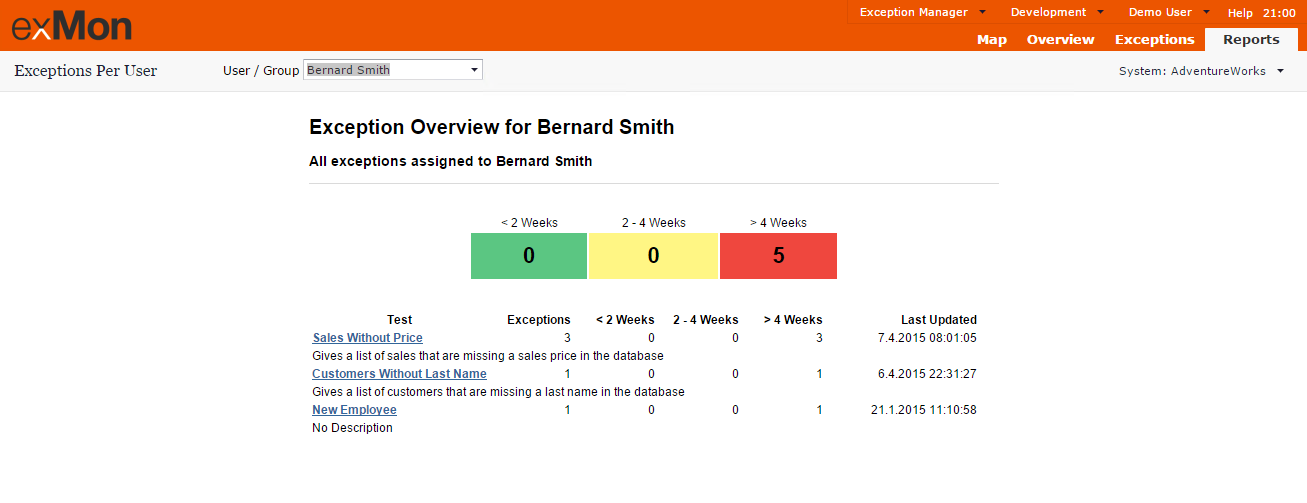
An example of a report is viewed on the portal. The report can be filtered to a specific user to view his progress.
Exception Map
It can be helpful to see how queries fit in a specific business process. For example, in a sales process, exMon can be used to monitor each step of the way, from product and customer attributes, to the order, to the payment, and finally to the delivery.
In the Map section of the exMon Portal, you can see a map of each business process that has been defined in exMon Data Governance.
Each Query, or a group of queries, sits on top of a map of a business process. Each Query is either Green or Red; Green for queries with no open exceptions and red for queries with open exceptions. Next to the Query, you can see how many exceptions are open each step of the way.
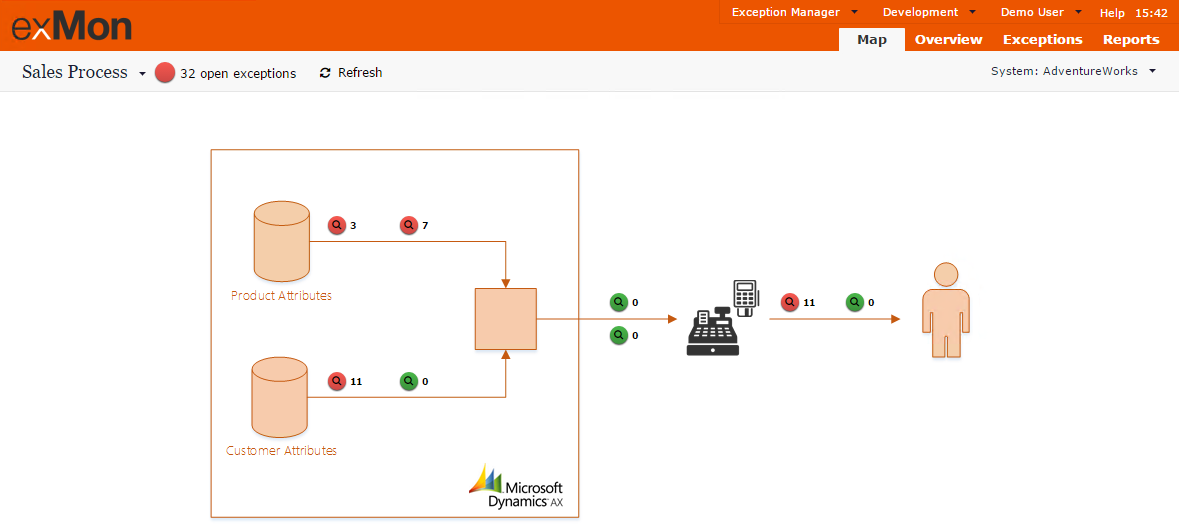
You can hover over the Queries to see a more detailed view for the Query, and if it is a group of Queries, then you see a detailed view for each Query.
If there are many business processes defined, you can move between maps by hovering over the map name in the top left corner.
Exceptions maps are a great way to get an overview of the state of business processes, keeping everyone informed, and also good documentation of the process.
Kristinn is the author of this solution article.