.svg)
Created by: Harpa Guðrún Hreinsdóttir
In this tutorial, you will learn how to create your first query in exMon DG. This simple Query will monitor sales with discounts 30% or larger. You will learn how to:
- Format the result columns to make them more readable
- Use the Exception Manager to track exceptions and send emails when new exceptions appear
- Add the query to a Schedule that will make the query run every day at 2:30 pm.
- Use the exMon Portal to see an overview of open exceptions and work with the exceptions.
Contents:
Getting Started with exMon DG
Let's start by opening up exMon Data Governance.
- From the exMon Data Governance tree menu, select Tests > New… > Query
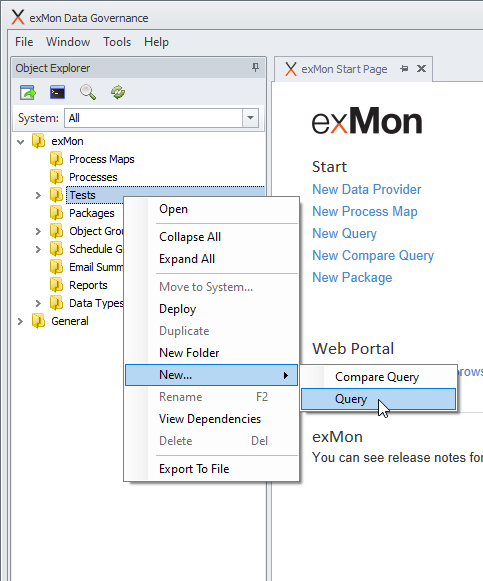
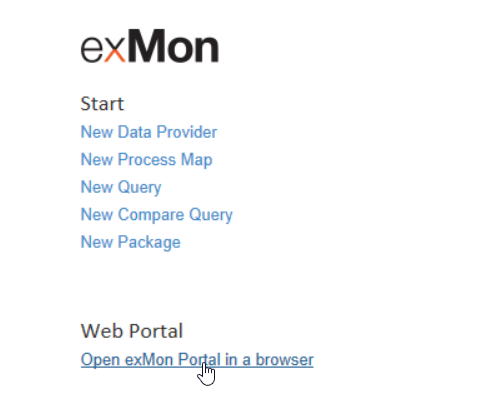
Or you can also click New Query from the starting page.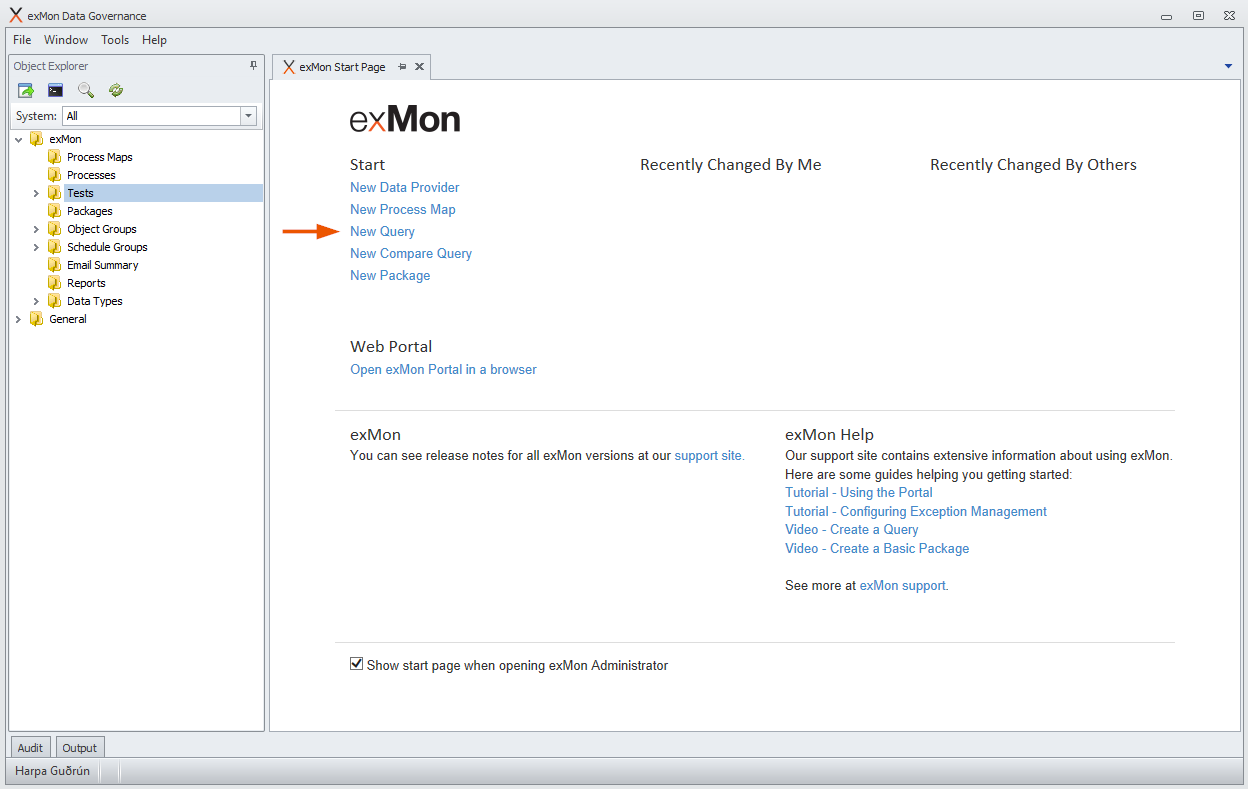
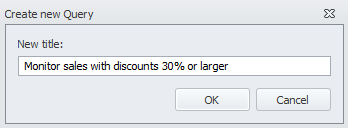
- In the Create a new Query popup, enter a Query name (In this example we will call it 'Monitor sales with discounts 30% or larger', and then select OK.
Creating the Query
Now we can start configuring the query itself. Since we want to monitor sales with discounts of 30% or larger in the database exMonDG_Demo.
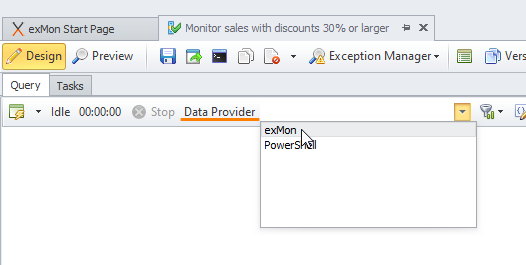
Our first task is to pick the Data Provider we want to be working with.
- From the Data Provider dropdown, select > exMon. This is the name of the data provider which is connected to the exMonDG_Demo database that we want to be working on within this demo.
- Paste the following SQL query into the textbox. This SQL statement checks to see if there is a record of sales with discounts 30% or larger?
-
SELECT

    header.SalesOrderID, detail.SalesOrderDetailID,

    header.AccountNumber, product.ProductId, product.Name, product.ProductNumber,

    detail.UnitPrice, detail.OrderQty, detail.UnitPriceDiscount, detail.LineTotal,

    header.OrderDate,

    cust.LastName as CustomerLastName,

    cust.SalesPerson

FROM [Demo].[SalesOrderDetail] detail

left join [Demo].[SalesOrderHeader] header on detail.SalesOrderId=header.SalesOrderID

left join [Demo].[Product] product on detail.ProductID=product.ProductID

left join [Demo].[Customer] cust on header.CustomerID=cust.CustomerID

where detail.unitpricediscount>=0.3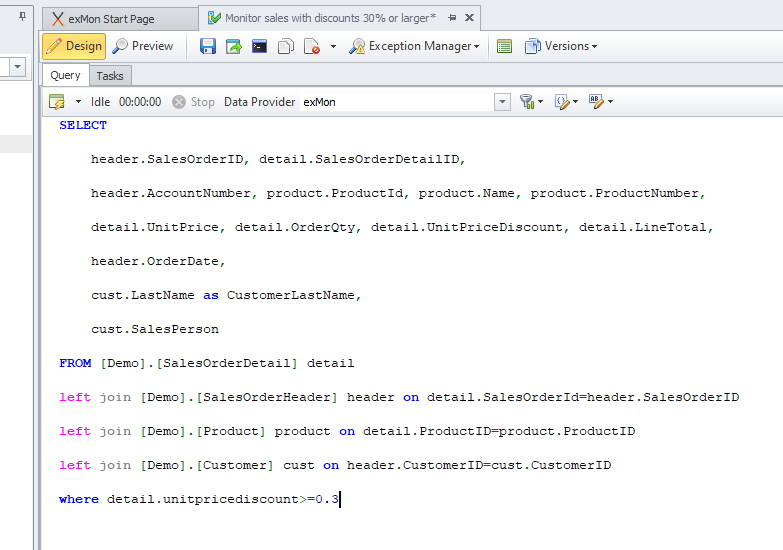
-
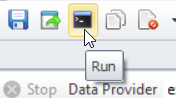
To run the query, click the green button with lightning (or press F5) and the output will appear in the textbox at the bottom.
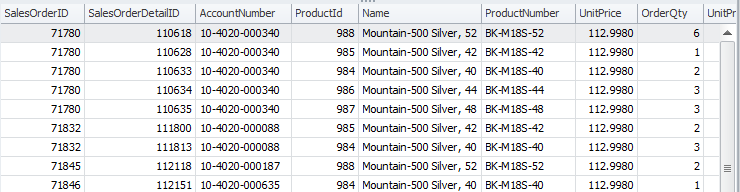
Results from the Query
Format Columns
As we can see the values in the results could look a bit more formatted. For example, we might want to change the names of the columns to something a little bit more readable. You can do all of this, and more, in Column Formatting.
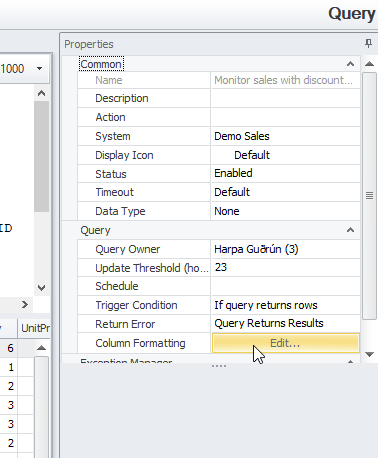
- Start by running the query by pressing the green button with lightning (or press F5)
- To the right, in the properties panel, press Edit…
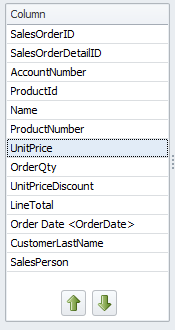
- To the left, we see a list of all the columns in our output. Select the column OrderDate.
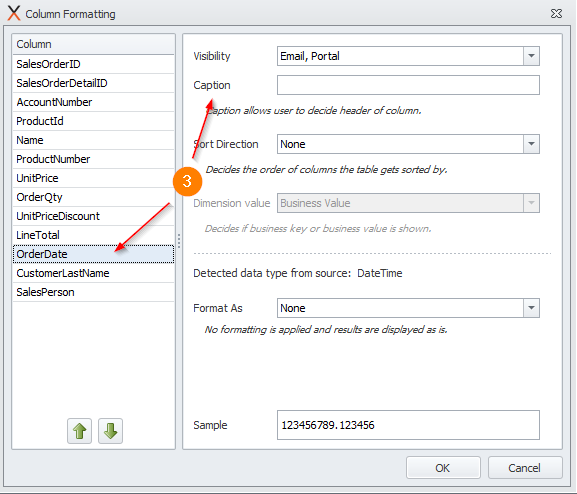
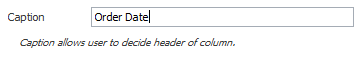
- To the right, set the Caption for the column as 'Order Date'. The same name but with space in between to make it more readable.
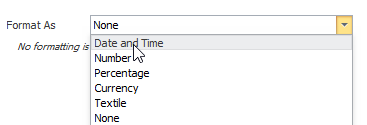
- In the Format as dropdown, select Date and Time.
- Let’s select a new column, called UnitPrice
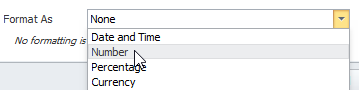
- In the Format as dropdown, select Number
- Finally, let’s use two decimal places and check the Use 1000 separator
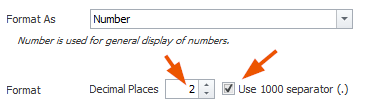
- Click OK
Preview
Now we can try to preview our column formatting changes but we need to save our changes first.
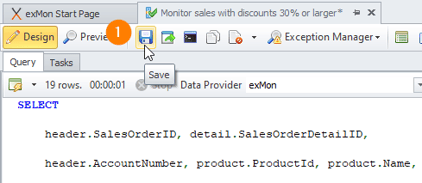
- To save we press the Save icon button in the top panel.
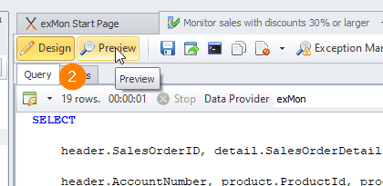
- To see the changes we just made from Column Formatting we can press the Preview button in the top panel.
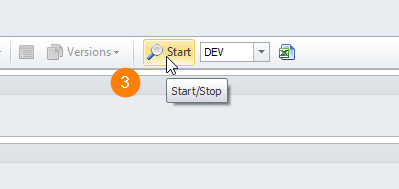
- Inside the Preview, we need to press Start to update our results.
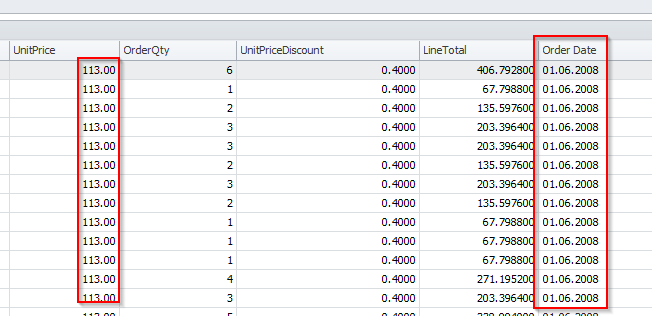
- Now we see our results and the changes we have made to the columns OrderDate and UnitPrice.
- Now, let's go back to Design Mode again by pressing the Design button on the top panel.
Exception Owner
Our next job is to enable and configure the exception manager.
When a query is run and it returns results, the exception manager creates an exception for each row and keeps track of the exception until query results no longer contain the row.
Our first step in the exception manager is to enable it and decide the owner of each exception.
The query owner is the default owner of all exceptions.
- Select Design
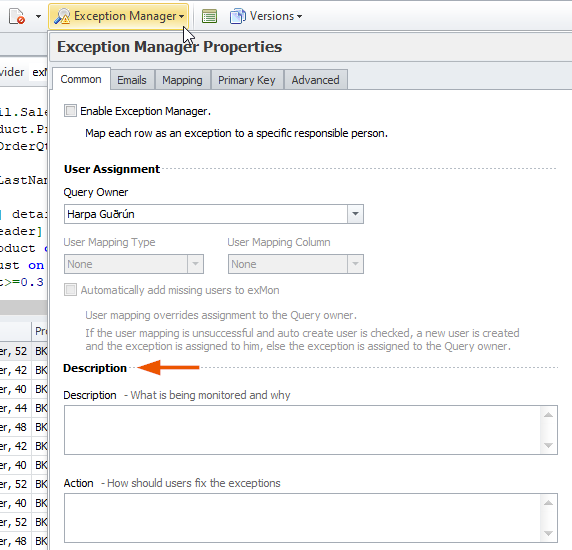
- Then open the Exception Manager popup from the top panel, with the Common tab open.
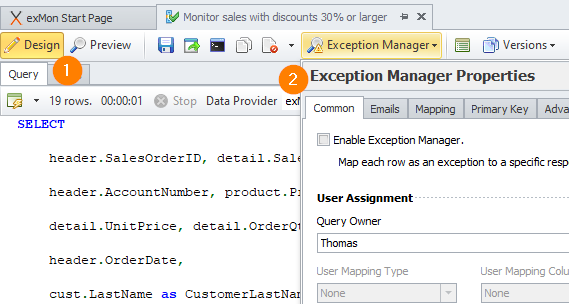
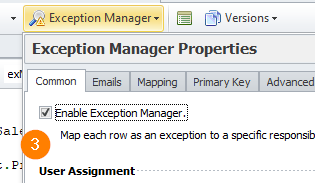
- Check the Enable Exception Manager
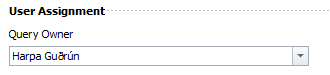
- Select your own use as the Query owner in the dropdown
Query Description and Action
Next, we‘re going to write a description and an action for the query. We do this to make the process of fixing failures easier.
The description field should as the name indicates, describe what the query does.
The action field should give a detailed description of what actions need to be done, to resolve failures should they arise.
To set these values we need to open up the Exception Manager dropdown in the top panel and have the common tab selected.
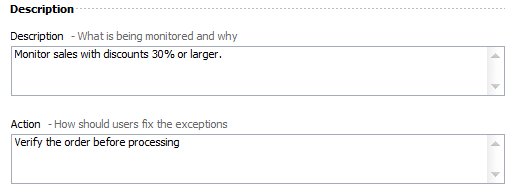
At the bottom, you can see a section called Description which contains textboxes to set the description and action values.
- In the Description field, write 'Monitor sales with discounts 30% or larger.'
- In the Action field, write 'Verify the order before processing'
Preview before Email formatting
Let‘s try to preview our results again by pressing save first, then Preview in the top panel, and finally Start like before to update our results.
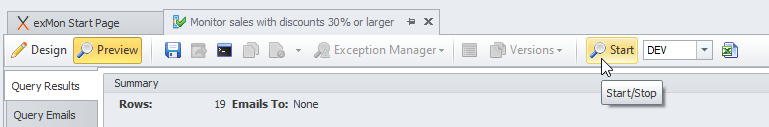
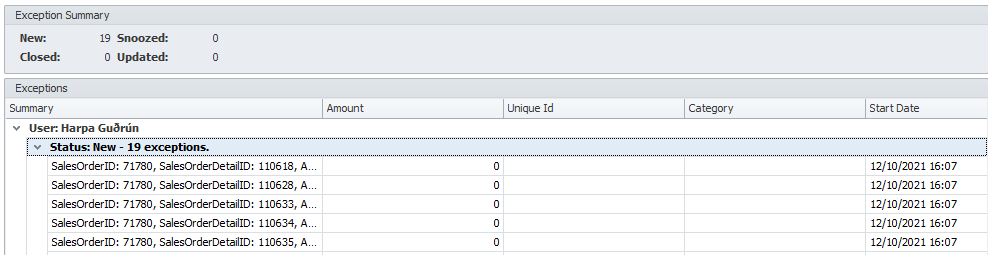
Now we can see that the Exception Summary has been updated. It used to say 'Exception Manager is disabled' but now we actually have some exceptions.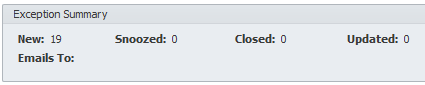
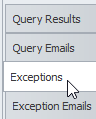
Then you can select the Exceptions tab from the left panel to see a more detailed view of our exceptions.
Then we can expand the tree list to see our exceptions.
Now, let's go back to Design Mode again by pressing the Design button on the top panel.
Exception Email
Next, we‘re going to configure emails that the exception manager will send. Now we are currently collecting the exceptions but we are not sending any emails.
Our goal is to send an email every time a new exception appears.
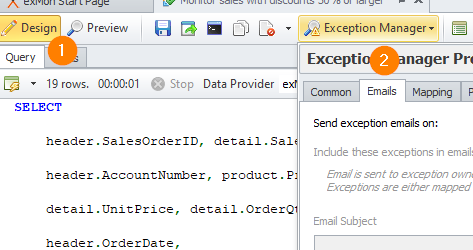
- Open Design
- Open the Exception Manager popup with the Emails tab open
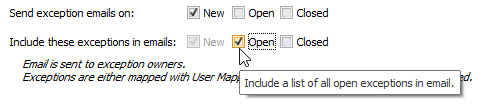
- In the line Send exceptions email, check New
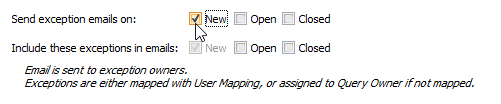
- In the line Include these exceptions in email, check Open. Also, New should be checked and disabled. By checking this option we include a list of all open exceptions in the email.
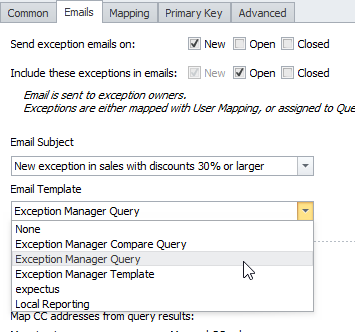
- In the Email subject field, type 'New exception in sales with discounts 30% or larger'
- In the Email template field, select Exception Manager Query
- Click Save
Now, we have configured the query‘s exception manager to send emails only when the query creates a new exception that the user is the owner of. The email sent will contain all new and open exceptions the user is the owner of.
Preview Email
Let‘s try to preview our results again by pressing save first, then Preview in the top panel, and finally Start like before to update our results.
- Open Preview and click Start
- Select the Exception Emails tab in the left panel
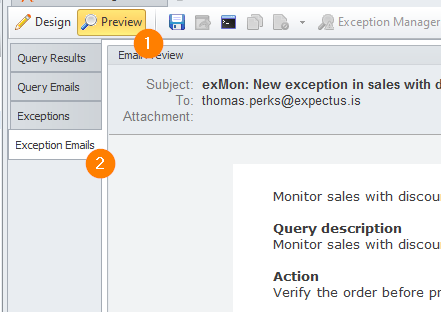
- Now we can see a preview of the email that will be sent. It should look something like this:
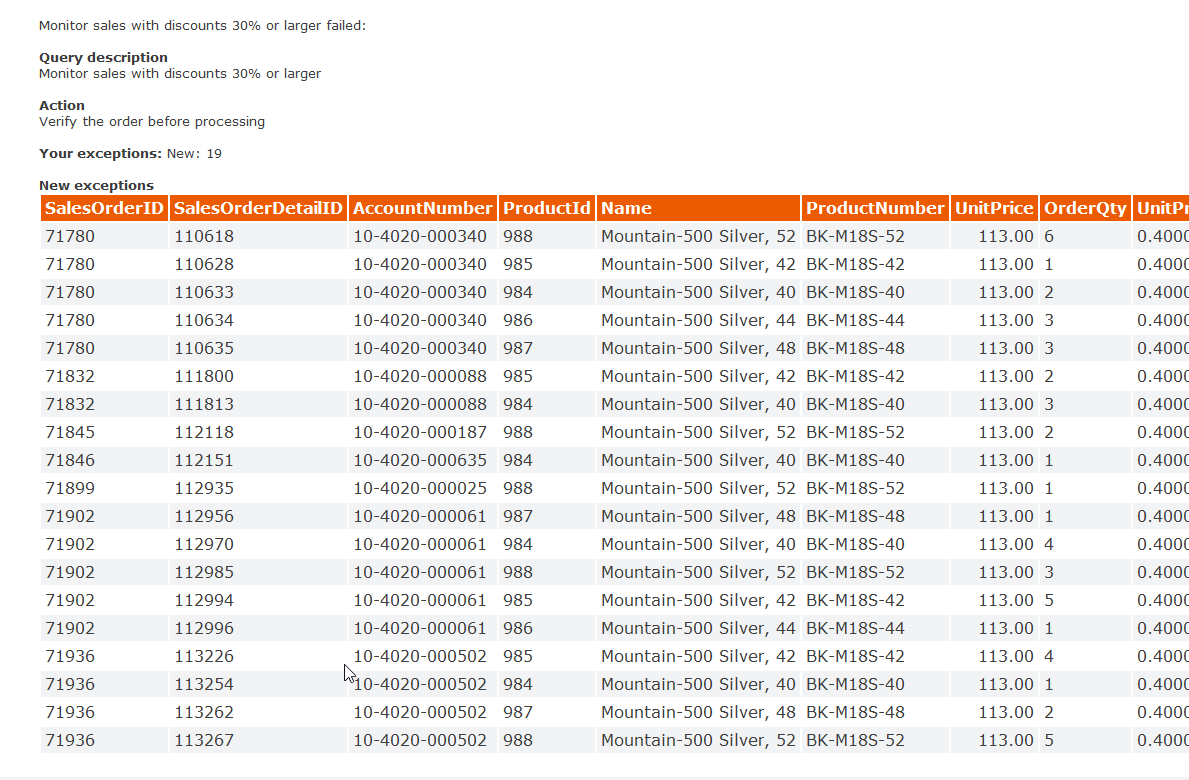
Now, let's go back to Design Mode again by pressing the Design button on the top panel.
Exceptions Primary Key
The core of the exception manager is that each exception has a unique primary key.
This unique key can be a single column or a composite key made out of multiple columns, but it can only occur once in the results of a test.
The reason primary keys need to be unique lies in the way exception manager works. If an exception occurs, a user (normally the exception owner) will have to change value columns in the underlying data source, to fix the exception.
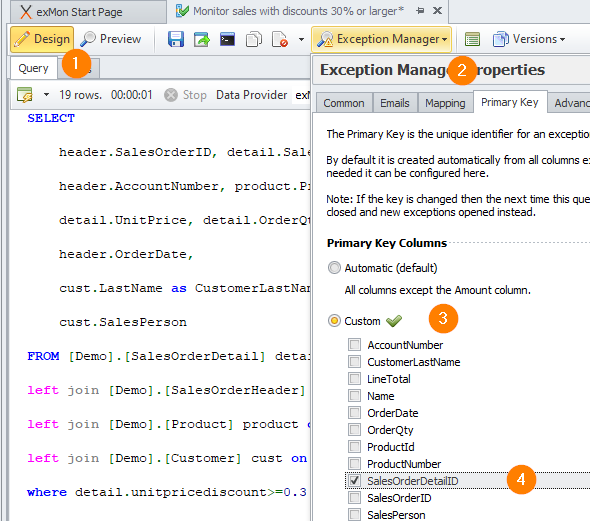
Let‘s add a primary key to our query.
- Open Design
- Click Exception Manager
- Click Custom
- Select SalesOrderDetailID. We know that this column is unique and therefore is a great column to choose as our primary key.
Deploy your Query
Now the final step before our query is in production is to deploy it.
- Let's first make sure that we have saved our changes by pressing the Save button.
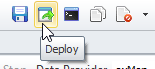
- Press the deploy button in the top panel.
- If the Test environment is enabled, select the correct environment deployment, otherwise skip this step.
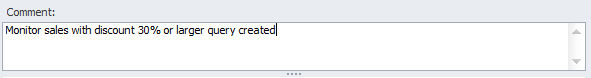
- Write a comment, detailing the changes being deployed, for example, Monitor sales with discount 30% or larger query created.
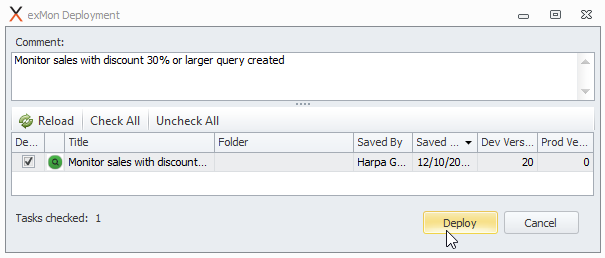
- Make sure to check the line Monitor sales with discounts 30% or larger and press deploy
Run your Query
Now if we would like to simulate the execution of the query we can try running the query.
- Press the Run button in the top panel.
- In the Run Task popup, unselect Mute all emails and choose which user you would like to receive the email within this demo run. Just to see what they would look like.
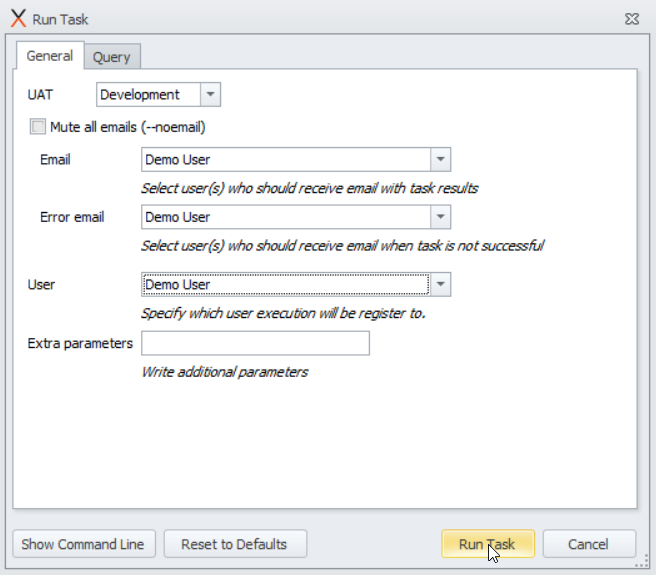
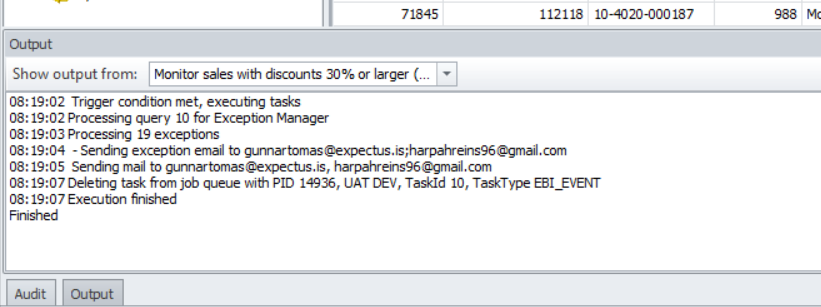
- Finally press Run Task. You can see if it was successful or not in the output window at the bottom panel.
Add To Schedule
Schedule Groups are used in exMon to schedule automatic executions of objects. You can easily create your own custom schedule group but in this demo, we will use a pre consisting Schedule Group which is located in the properties pane within the query.
- Find the Query Properties panel to the right
- Click the Schedule dropdown > Select the option Every Day
- Click Save
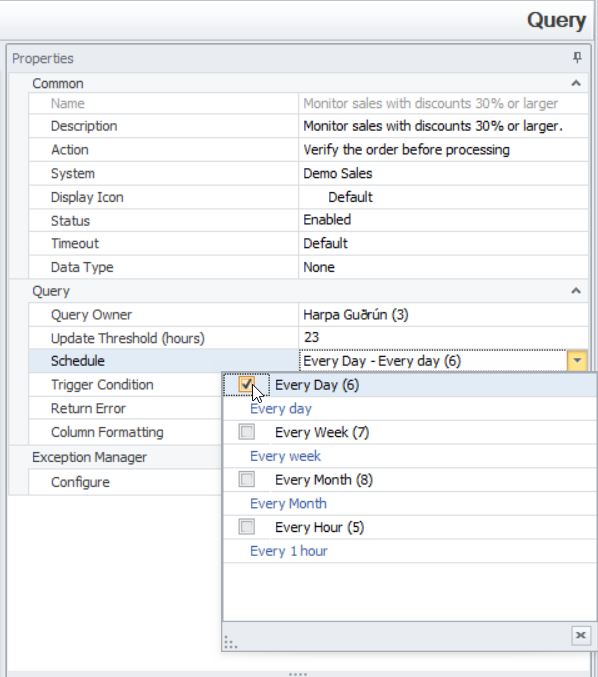
This means that our query will be run every day (at 14:30 which is the default).
Use exMon Continuous Monitoring Portal
In the exMon Portal users get an overview of open exceptions, work with exceptions and analyze exceptions trends. For a more detailed overview of the portal, read Using the exMon Continuous Monitoring Portal (Tutorial)
Getting started with the Portal
To open the portal Navigate to the URL provided by your exMon Data Governance or press the Open exMon Portal in the browser from the exMon Start Page.
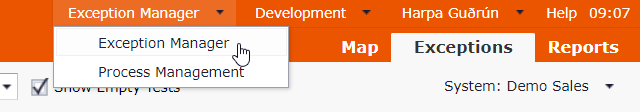
- Select the Exception Manager option from the module selector
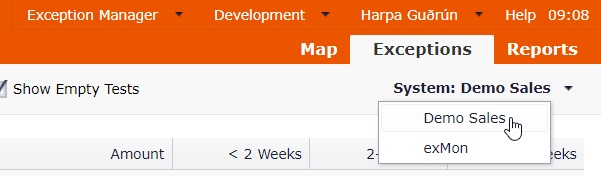
- Select the system Demo Sales from the system selector.
Exception Overview
The main entry point into the portal is the Overview page. The overview displays information about all queries with open exceptions in the current system.
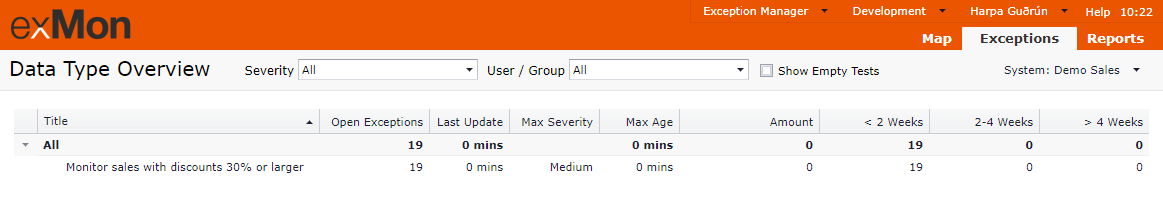
Columns in the overview are the following:
- Title: Names of queries (Tests) categorized into Data Types.
- Open Exceptions: Number of open exceptions, exceptions that need to be acted on.
- Last Update: Date of the latest update of the Query.
- Max Age: Age of the oldest open exception of the Query.
- Amount: Sum of the “Amount at Risk” column for all open exceptions.
- Weeks: Distribution of open exceptions by age.
Exceptions
If you click the Query title of our new Query Monitor sales with discounts 30% or larger on the Exception Overview page you will get a list of all open exceptions for a Query.
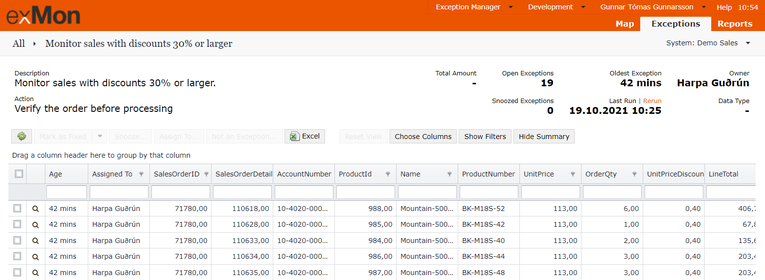
At the top, we have summary information about the selected Query and its exceptions.
- Description: Description of what the Query is monitoring.
- Action: Description of what actions should be taken to fix the data quality issue.
- Total Amount: Sum of “Amount at Risk” for open exceptions.
- Open Exceptions: Number of open exceptions.
- Snoozed Exceptions: Number of snoozed exceptions. That is exceptions that are open but temporarily hidden from the exception page. Snooze is covered later in this article.
- Oldest Exception: Age of the oldest open exception in the Query.
- Last Run | Rerun: The date when Query was last executed. If you have enough privileges, you can choose to execute the Query with the Rerun button.
- Owner: Query Owner as defined for the Query, the person who is responsible for the Query.
- Data Type: The data type the Query is in.
Exception Actions
You can perform four actions on each exception:
- Mark as Fixed
- Snooze
- Assign To
- Not an Exception.
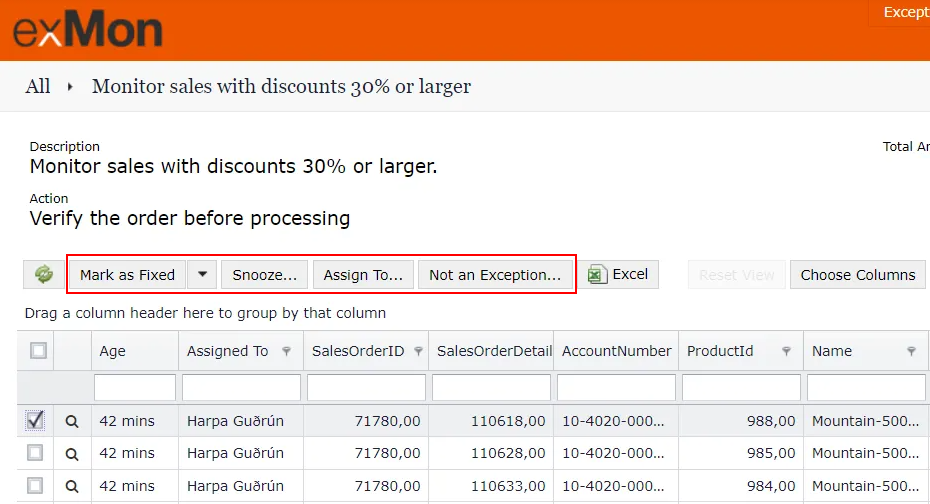
When you select an exception the action buttons are enabled.
Mark as Fixed
By marking an exception as fixed, exMon treats the exception as if it has been fixed and hides it from the list of open exceptions. When the Query is executed next, the exception will stay closed if not found, or reopened if it is still found in the source system.
Snooze
Snoozing an exception temporarily hides the exception until a specific date. This can be useful if solving the exception depends on an external person or events.
If the Query is executed while an exception is in the snoozed state, and the exception is not found in the source system, then the exception will be closed.
Assign To
In exMon, all exceptions are assigned to a specific user or a group, which is then responsible to work on the exception.
You can assign exceptions to another user, or take ownership of an exception, with the Assign To action.
Not an Exception
When marking an exception as "Not an Exceptions", exMon will close the exception and never open it again, even if it is still present in the source system.
Your task is to play around with these buttons and make sure to at least:
- Mark one exception as Fixed
- Snooze one exception
- Assign one Exception to someone else
- Mark one as not an exception
- Observe how
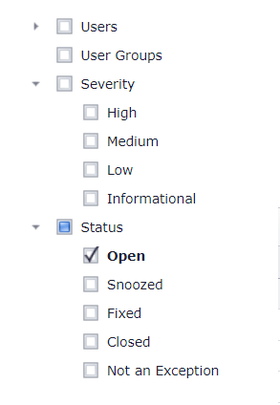
By default, the exceptions grid only displays open exceptions. You can use the Show Filters button to view exceptions in other states.
Select between Open, Closed, Snoozed and Not an Exceptions.
- Refresh the portal
- Try to play around with the filters to see different data based on your filtered option.
Final Results
Congratulations! You have now created a query that monitors sales with discounts 30% or larger. You Formatted the columns to be more readable, used the Exception Manager to track and send an email every time new exceptions are found, and finally added this newly created query to a schedule that runs this query every day at 2:30 pm.
When the query had been deployed we used the exMon Portal to get an overview of open exceptions and work with the exceptions.
Harpa is the author of this solution article.
